Oceanside expanded rapidly after Camp Pendleton was established in 1942, transforming from a small beach town into a city of over 175,000 residents. That growth pushed development onto terraced alluvial fans and old river terraces of the San Luis Rey River, where variable soil stiffness and hidden bedrock topography pose real challenges. Seismic tomography surveys help us map these velocity contrasts without drilling across every lot. Before we interpret the refraction wavefronts, we often cross-check with a resistivity survey to confirm stratigraphic boundaries, or use georadar GPR in shallow pavement areas where ultra-high resolution is needed. The combination gives a reliable 3D picture of the subsurface.
Seismic tomography in Oceanside’s alluvial terraces often reveals a velocity inversion at 15–20 m depth, a critical detail for foundation design on variable fills.
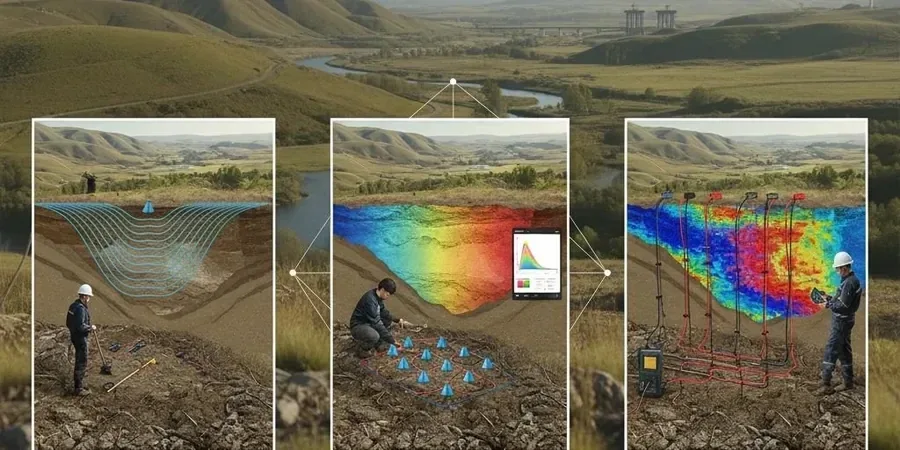
Method and coverage
Regional considerations
The San Luis Rey River valley sits on a deep sedimentary sequence underlain by Cretaceous granitic bedrock at variable depth. In Oceanside’s eastern neighborhoods, the water table can rise within 3 meters after winter rains, creating a low-velocity layer that masks deeper refractors. If the inversion is not recognized during processing, the calculated Vs30 can overestimate stiffness and misclassify the site as class C instead of D. That error directly affects seismic design forces under ASCE 7. We mitigate this by comparing the tomographic section with borehole lithology and running synthetic seismograms to test the velocity model before finalizing the report.
Standards that apply
ASTM D4428/D4428M-14 (Standard Test Methods for Crosshole Seismic Testing), ASCE 7-22 Section 20 (Site Classification for Seismic Design), NEHRP Recommended Seismic Provisions (FEMA P-2082, Vs30 criteria), IBC 2021 Chapter 16 (Structural Design, site class requirements)
Complementary services
Refraction Tomography for Bedrock Mapping
P-wave refraction surveys with 24-geophone spreads to delineate the top of granitic bedrock beneath alluvial cover. Typical depth of investigation reaches 25–40 m, with velocity contours accurate to within 10%.
MASW Surface-Wave Profiling for Vs30
Multichannel analysis of surface waves using a 48-channel land streamer. Output includes shear-wave velocity profiles to 30 m depth, directly used for NEHRP site classification and seismic site response analysis per ASCE 7.
Reflection Seismics for Fault and Stratigraphy
High-resolution P-wave reflection profiling with a mini-vibroseis source for detecting shallow faults and stratigraphic pinch-outs. Applied in Oceanside’s fault-adjacent zones near the Rose Canyon fault system.
Typical parameters
Top questions
How deep can seismic tomography see in Oceanside’s soils?
Typical refraction surveys reach 20–35 m depth with a sledgehammer source. If deeper targets are needed (40–60 m), we switch to an accelerated weight drop or seismic shotgun and increase the spread length to 200 m or more. In the alluvial terraces near the San Luis Rey River, the granitic bedrock is often found between 18 and 30 m, so the standard setup works well.
What is the difference between refraction and reflection tomography?
Refraction tomography uses first-arrival travel times of P-waves to build a velocity model of the subsurface, ideal for mapping layer boundaries and bedrock depth. Reflection tomography processes later-arriving reflections off stratigraphic interfaces, giving higher resolution for thin layers and fault detection. In Oceanside, we typically run refraction for site class work and add reflection when a fault is suspected within the project area.
How much does a seismic tomography survey in Oceanside cost?
A standard refraction tomography survey with 3 lines and 24 geophones per line typically falls between US$2,720 and US$5,340, depending on access conditions and the number of source points. MASW surveys for Vs30 are usually at the lower end of that range, while reflection surveys with a vibroseis source can reach the higher end. We provide a fixed-price quote after a quick site visit.
Can seismic tomography replace borings for site classification?
No, but it reduces the number of borings needed. The IBC and ASCE 7 require at least one boring for site class confirmation when using geophysical methods alone. In Oceanside, we recommend combining two to three SPT borings with a seismic tomography line to achieve a NEHRP Site Class determination with high confidence. The tomography fills the gaps between boreholes and identifies velocity inversions that a single boring might miss.